Java’s Garbage Collector is one of the key features in the Java environment. When you develop in Java, the objects you instantiate are allocated in the heap of the Java Virtual Machine. In Java you don’t have to think about how to allocate and deallocate objects in memory.
For an object that is no longer used, the Garbage Collector finds them by deduction. Most people think GarbageCollector finds unused objects in the heap space memory and removes them, in fact it’s the active objects that are tracked, everything else is marked for garbage collection.
Periodically, the GC scans objects located at the root of the heap memory space and defines the graph of alive objects.
Without garbage collection, the heap would eventually run out of memory, leading to an OutOfMemoryError runtime error.
There are 4 kind on GC root objects in java:
- Class: Classes loaded by a system class loader; contains references to static variables as well
- Local Stack: Local variables and parameters to methods stored on the local stack
- Active Java Threads: All active Java threads
- JNI References: Native code Java objects created for JNI calls; contains local variables, parameters to JNI methods, and global JNI references
How does it works ?
The process of garbage collection involve 2 principal steps: track living objects and remove unmarked ones (non-living).
The Marking phase
Garbage collection starts by scanning all root objects and follow the references from the root to other objects and marks every object found as alive.
All unmarked objects are candidates for garbage collection.
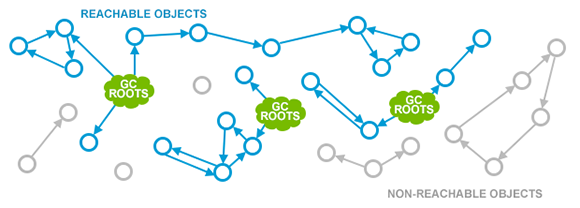
Objects marked as alive are blue in the above picture.
The important aspects to note about the marking phase is the application threads need to be stopped (you cannot traverse the graph if it keeps changing all the time).
Good to know: when the application threads are temporarily stopped the JVM can engage in housekeeping activities. It’s called a safepoint and results in a Stop-The-World pause.
safepoint can be triggered for different reasons but garbage collection is by far the most common reason for a safepoint to be introduced.
The duration of this pause depends on the total number of alive objects. That’s why heap size doesn’t change the duration of the marking phase.
Removing unreachable objects
Once the marking phase is done, the garbage collector activities can be divided in 3 main groups: sweeping, compacting and copying.
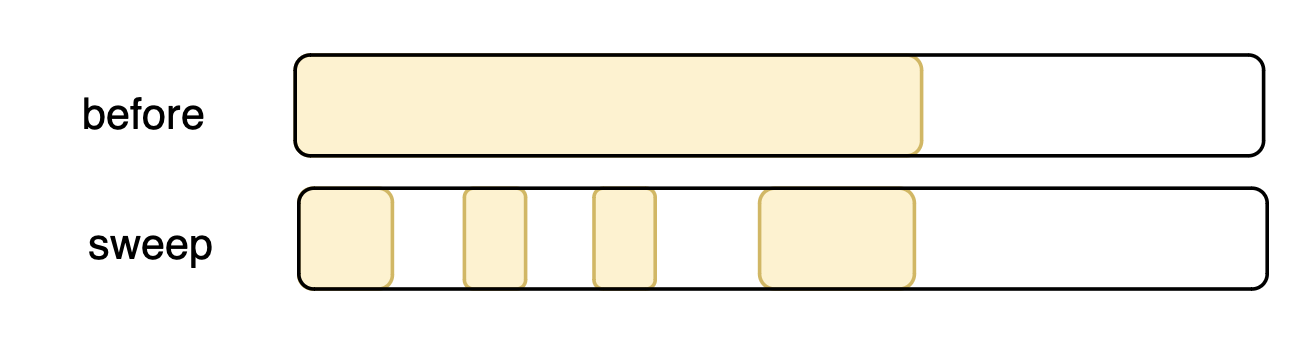
- Sweep Mark-and-Sweep is the simplest approach to garbage collection. It’s just ignoring the unmarked objects. For example all the heap is used by unmarked objects (not attached to a GC Root Object :)), the space used by those object is considered free and can be reused for allocating new objects.
The tradeoff with this is that it implies to know each free memory region with its size, each of these are isolated if one object is bigger than all the regions available an OutOfMemoryError error occurs.
This approach imply an overhead during the allocation phase as the JVM needs to search a region to allocating the new object.
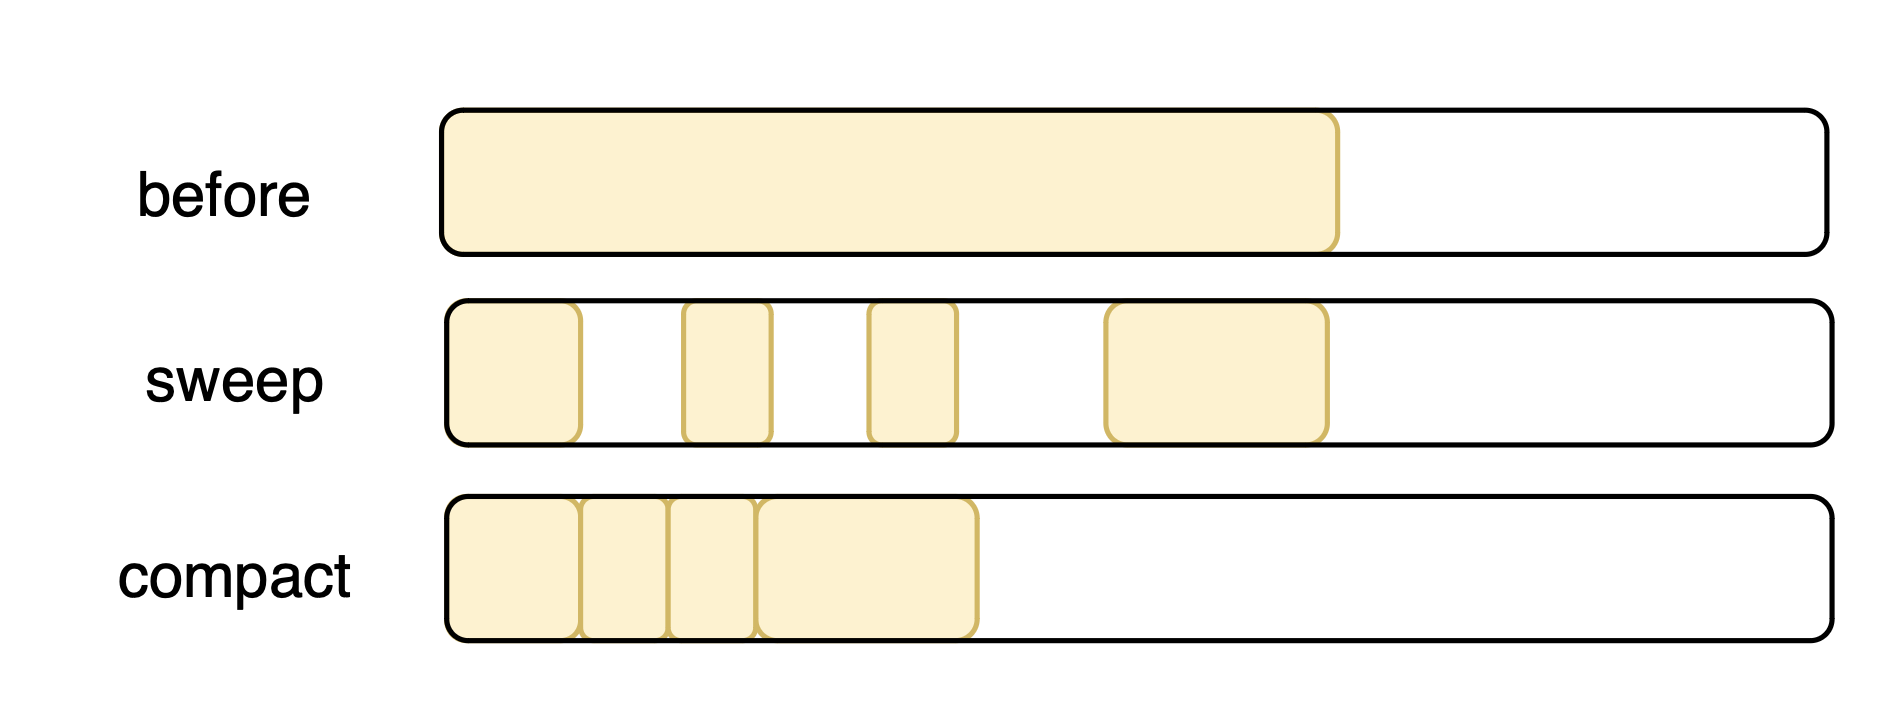
- Compact Mark-Compact solve the tradeoff of Mark-and-Sweep approach, by moving all marked (alive) objects at the beginning of the heap memory region. The downside with that it increases the GC Pause duration. The GC needs to copy all objects to a new place and update the references objects graph. Once the compaction is done, allocation is again extremely cheap with no fragmentation issues.
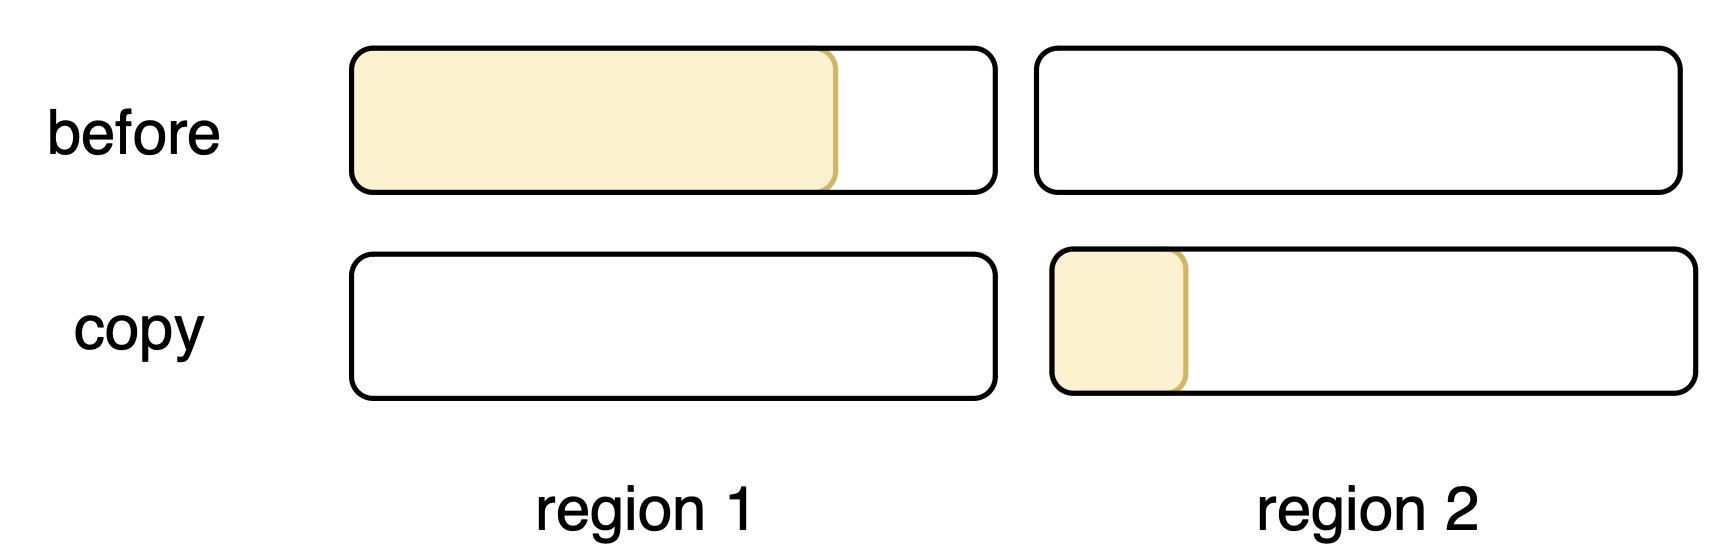
- Copy Mark-Copy looks like Mark-Compact, but the difference here is that objects are reallocated to another region rather than to the beginning of memory. These approach has the principal advantage as coping can occur simultaneously with marking phase but more memory region will be needed, large enough to hold surviving objects.
There are two main types of Garbage Collection algorithms: Full Garbage collection and Incremental Garbage collection
Full Garbage collection is when the garbage collector pauses the program’s execution and performs a search for garbage objects. All the heap space memory is scanned, the garbage collector marks and searches for garbage objects not used anymore in the app. During this phase application performance slowdown, caused by the GC pause. Full GC is usually triggered when there is not enough memory available or when the application’s memory consumption reaches a certain threshold.
Incremental Garbage Collection, avoid to pause the program’s execution to perform the marking process. The garbage collector divides the scanning process into small, manageable pieces called “increments”. During each increment, the garbage collector scans a portion of the program’s memory, identifying any objects that are not needed and marking them as available for reuse.
I won’t go into the details and describe all the CG events that exist. I’ll save it for another time but we can still describe some interesting points on how the heap space is separated and what is and what’s implies GC Stop the world (STW) and GC Pause.
Memory management is a critical aspect in the JVM. The heap space is separated into different regions to optimize the garbage collection.
Stop the world !
A GC Stop-The-World is when the JVM halts the execution of all application threads to perform a GC operation, during a STW event no application code runs and all processing is dedicated to garbage collection. A SWT event happens during: minor & major GC and certain phases of concurrent GCs (initial mark / remark phases in CMS). Any interruption of application execution due to garbage collection, implies GC pause. STW causes GC pause.
As said before, garbage collection is by far the most common reason for a safepoint to be introduced.
I’ll be writing about safepoint and its implications soon but in the meantime
When at a safepoint, the thread’s representation of its Java machine state is well described, and can be safely manipulated and observed by other threads in the JVM. When not at a safepoint, the thread’s representation of the Java machine state will NOT be manipulated by other threads in the JVM.
A Java thread is at a safepoint if it is blocked on a lock or synchronized block, waiting on a monitor, parked, or blocked on blocking IO. Essentially these all qualify as orderly de-scheduling events for the Java thread and as part of tidying up before put on hold the thread is brought to a safepoint.

Visual GC représentation
The memory space is separated in 3 parts, Young generation, Old Generation and Permanent Generation.
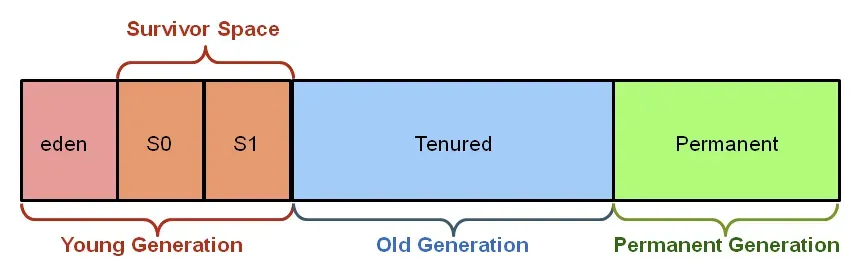
Young Generation
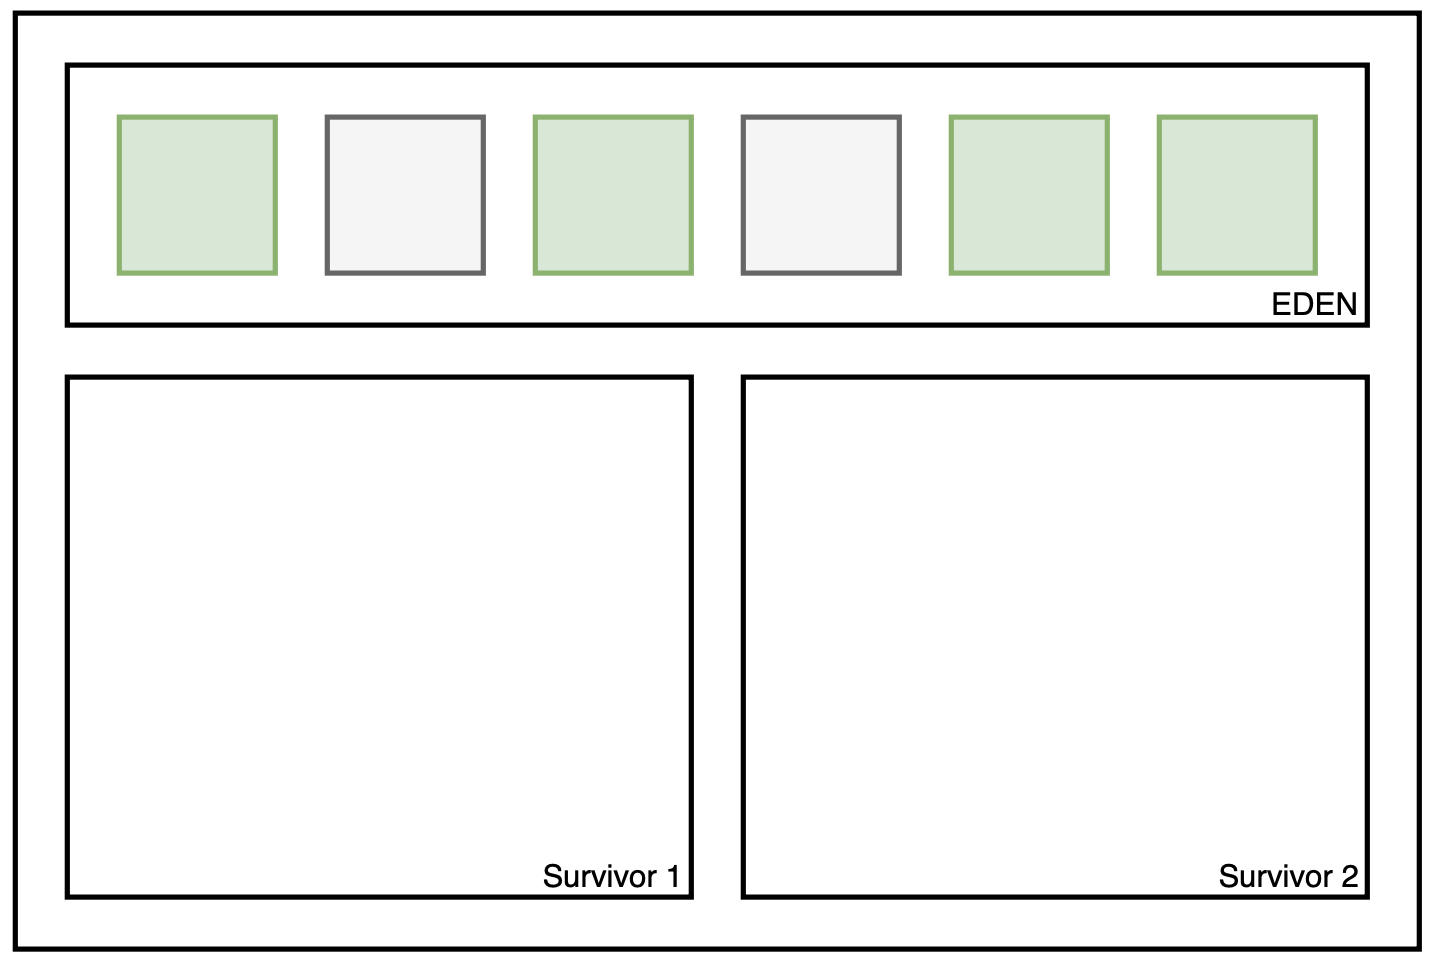
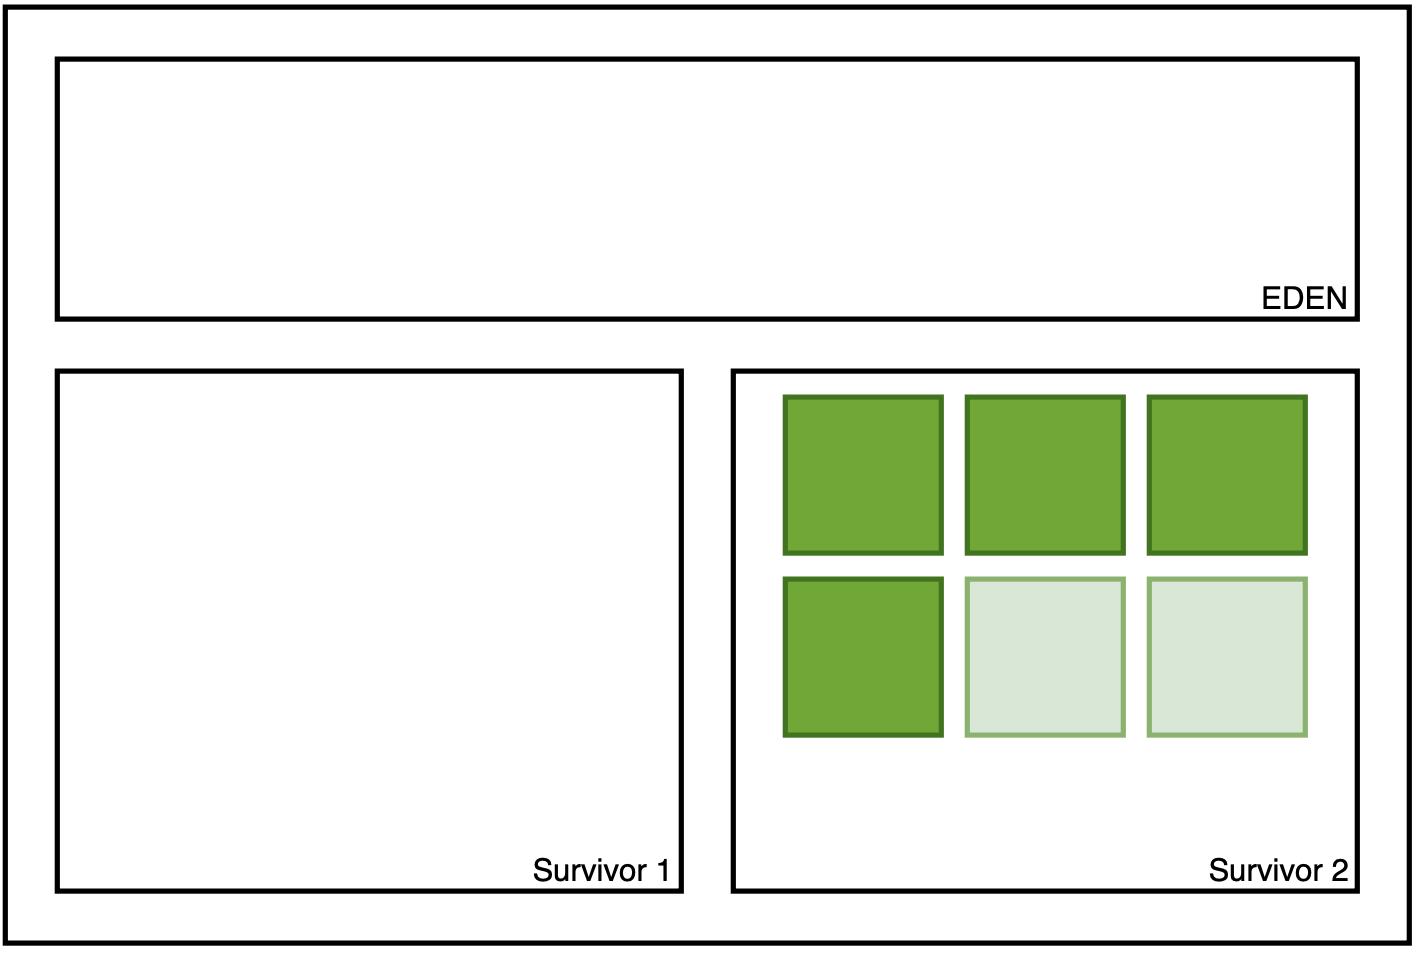
Young generation is the initial destination for newly created objects, especially those placed in the eden space.
When eden becomes full, a minor garbage collection starts and marked objects are moved to the survivor space (S0 and S1)
and those no longer in use (unmarked) will be removed.
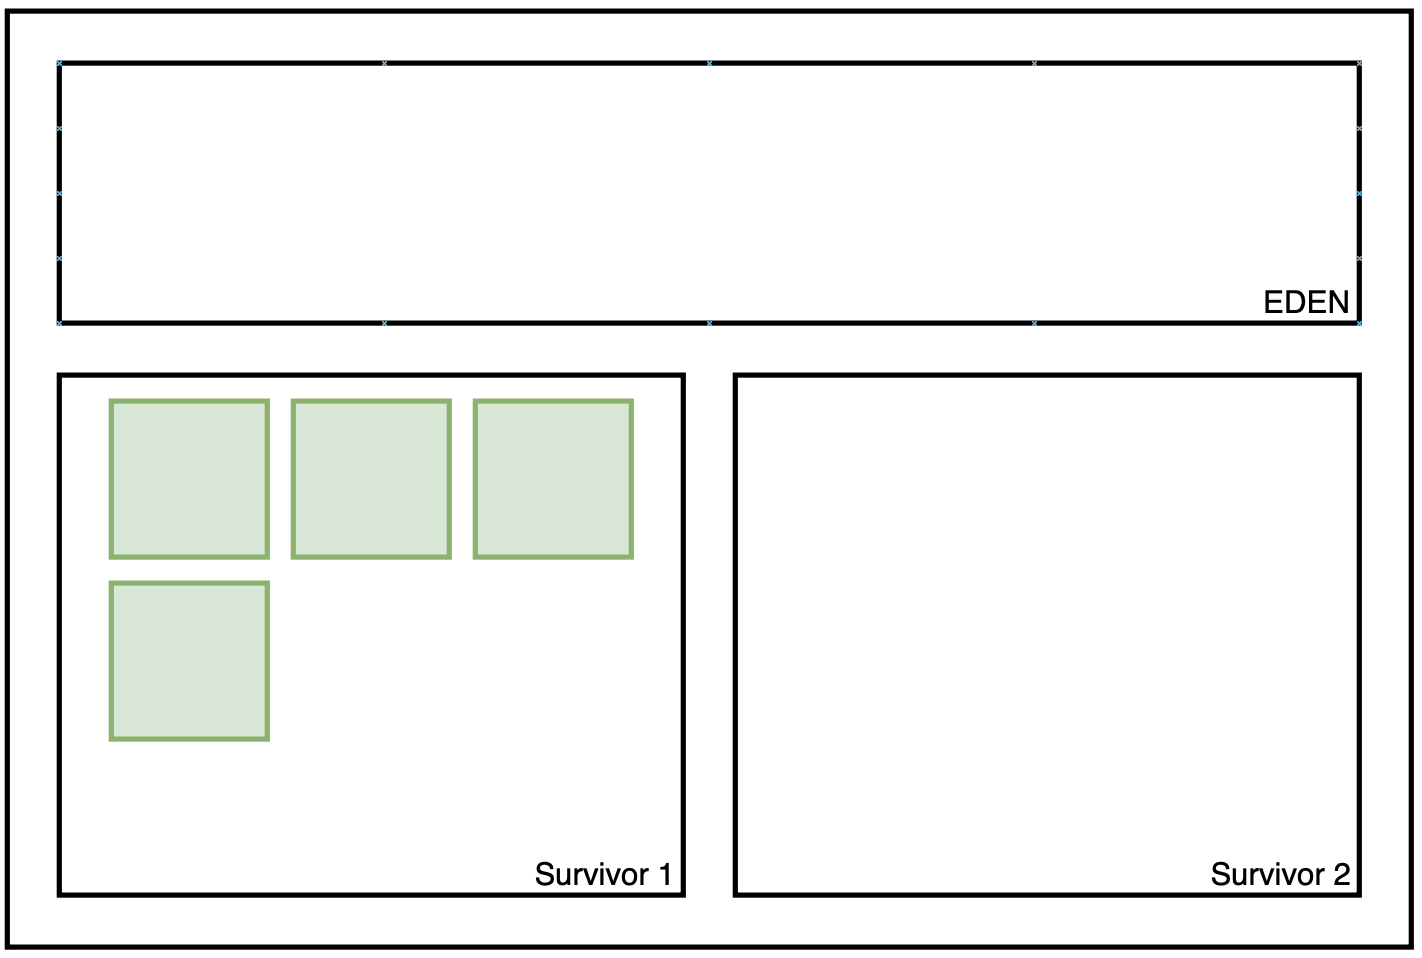
This pattern never stops, every time eden is full a minor garbage collection starts all over again and objects already located in S0 are moved to S1 survivor space. Objects located in S1 and have survived long enough (threshold depend on the GC algorithm) move to the old generation space.
after a minor GC, all objects will be moved to Survivor1, and dead object unmark
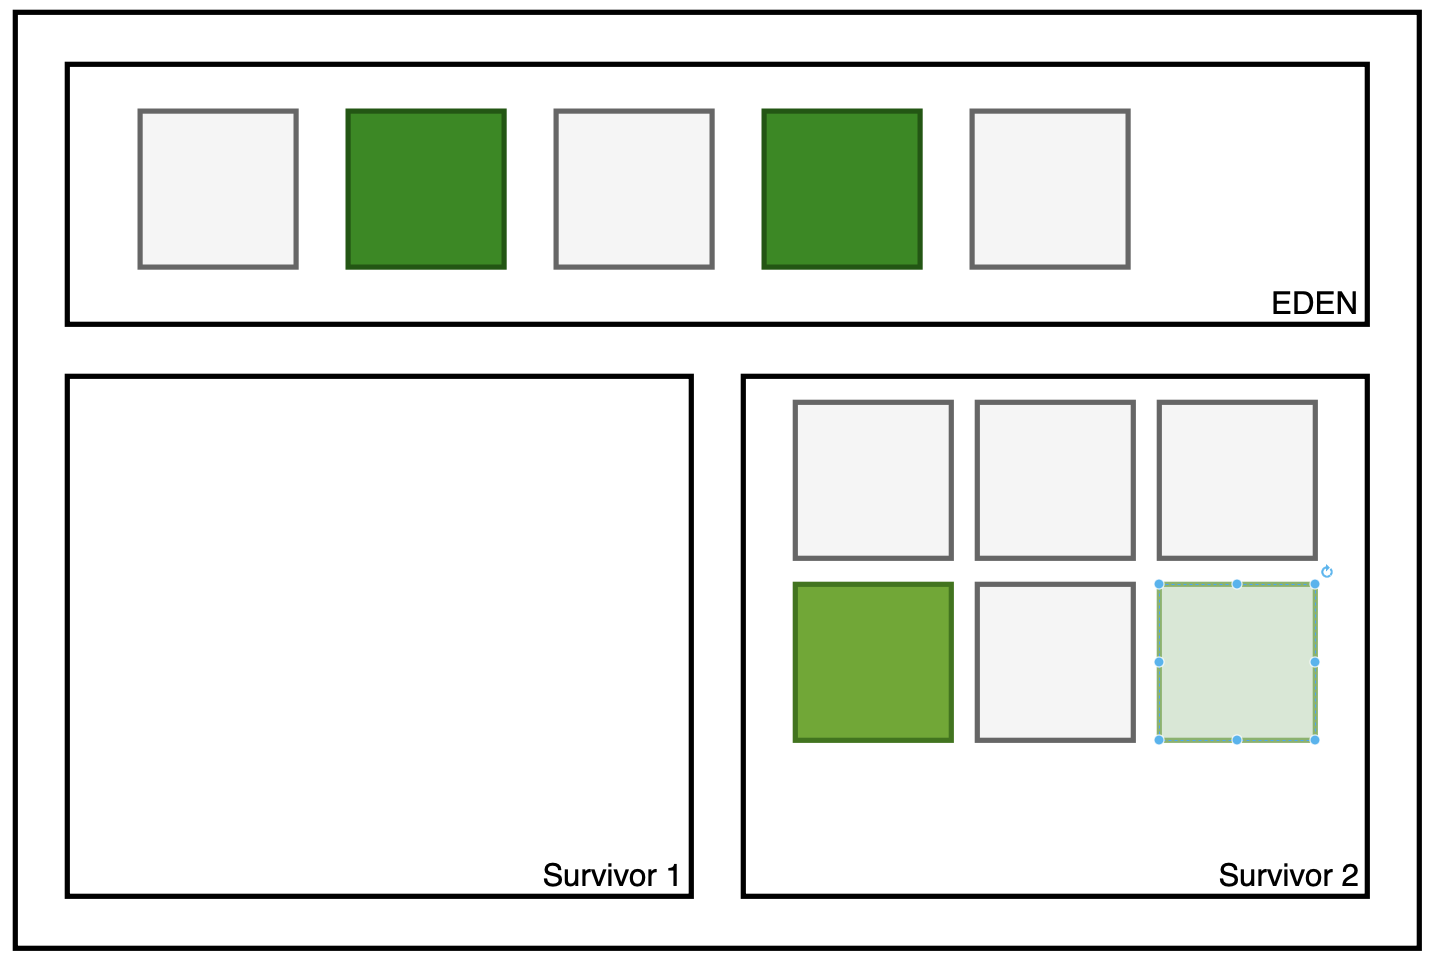
New objects get allocated in eden space, some object become unreachable in both eden space and survivor1
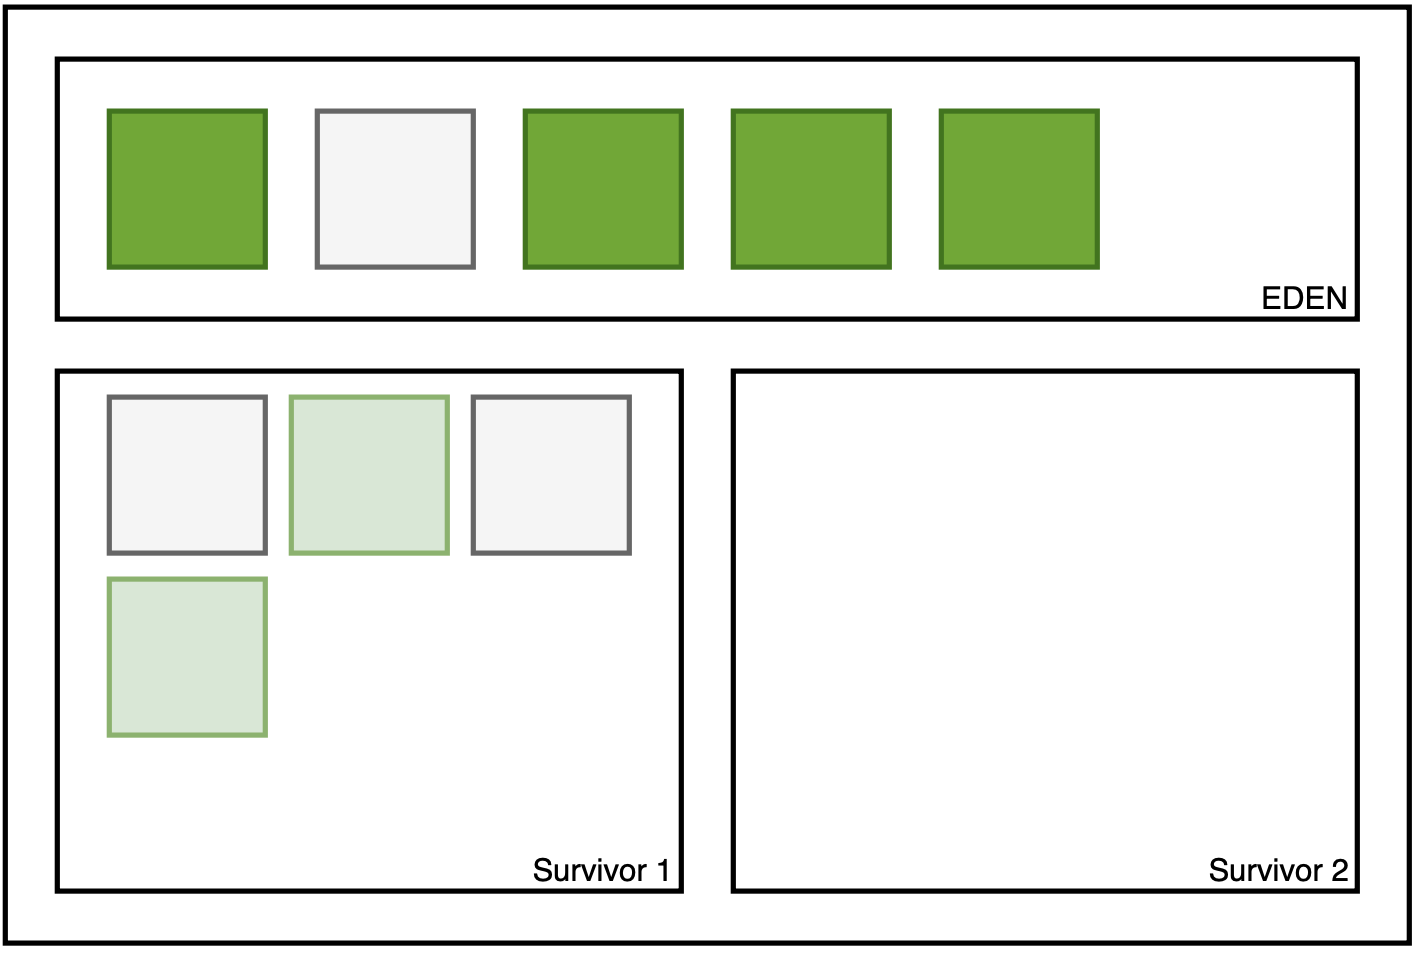
After a second minor gc, all marked objects will be moved to survivor2, and dead object unmark
After the third minor GC, all live objects will be moved from both Eden and Survivor 2 to Survivor 1 with age increase and dead objects will be deleted.
to
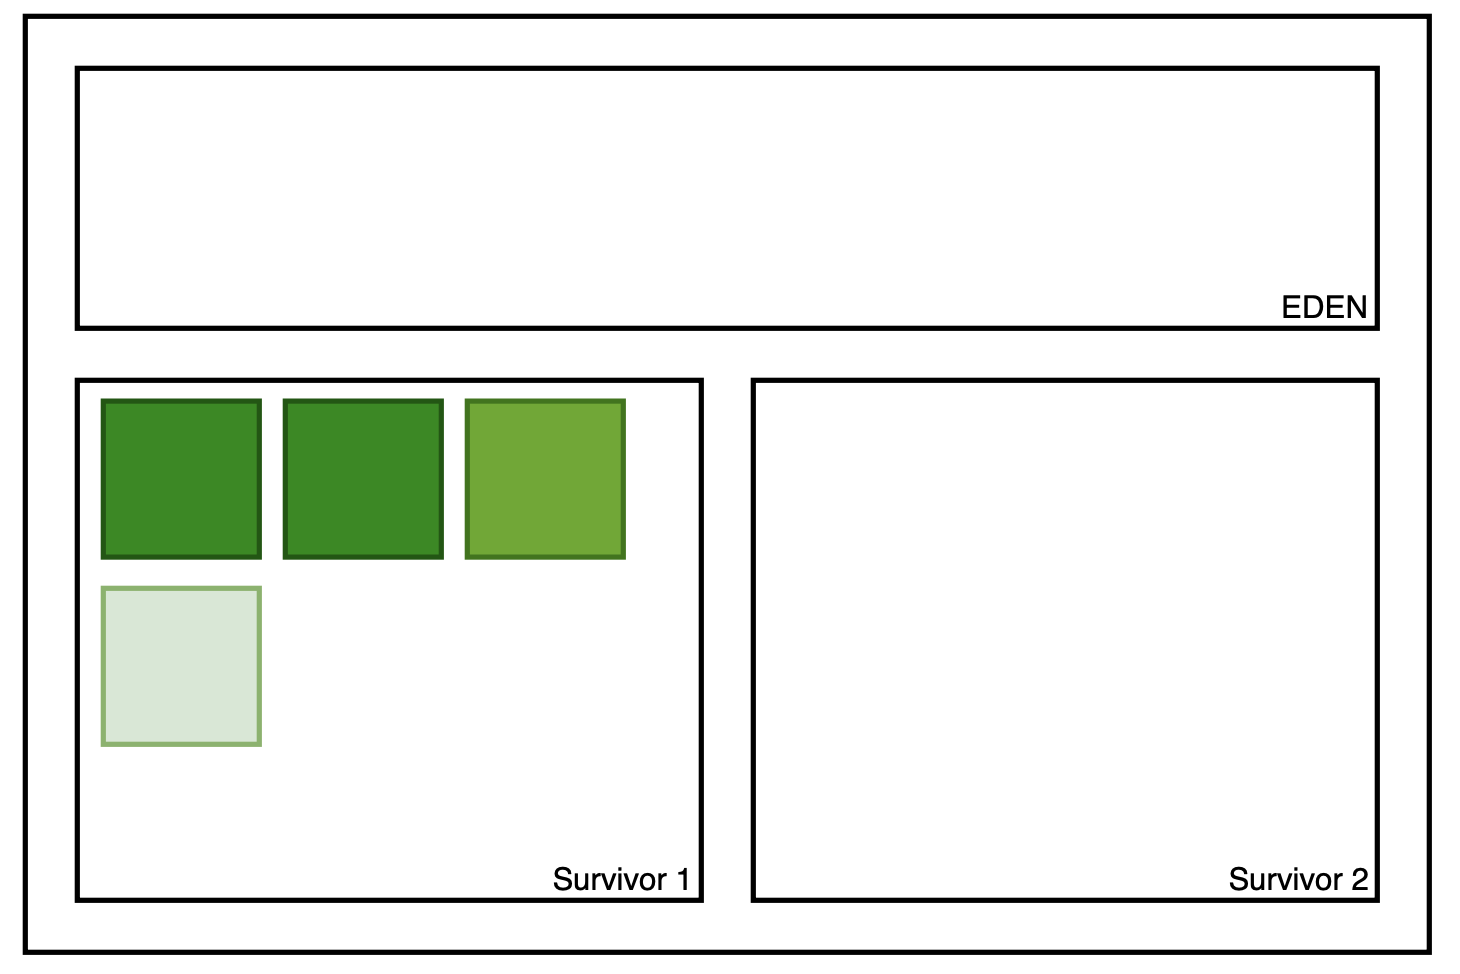
Old Generation
Objects located in the young generation and survived enough (depending on the GC algorithm) are moved to the old generation space.
The old generation, also known as the tenured generation, stores long-lived objects. When an object is garbage collected in the old generation, it triggers a major garbage collection event. A major GC typically causes a pause in the application, the pause can be noticeable and may impact application performance, especially if the Old Generation has accumulated a significant amount of live data.
Information: Major GC only targets the old generation heap memory space.
Permanent generation
With Java 8, the permanent generation space has been replaced by a new metaspace, which is designed to be more efficient and flexible.
Metaspace is not a contiguous heap area but is allocated in the native memory (to allow it to grow dynamically) and reduce OutOfMemoryError risks and improve performances, class loading/unloading can be more efficiently managed for applications that dynamically load many classes.
I hope you enjoyed this short introduction about how GC works. I plan to go further into the internal operation of the JVM and share in detail about the JVM synchronization, safepoint, and concurrent mark sweep.
If I’ve made a mistake, please let me know :)